
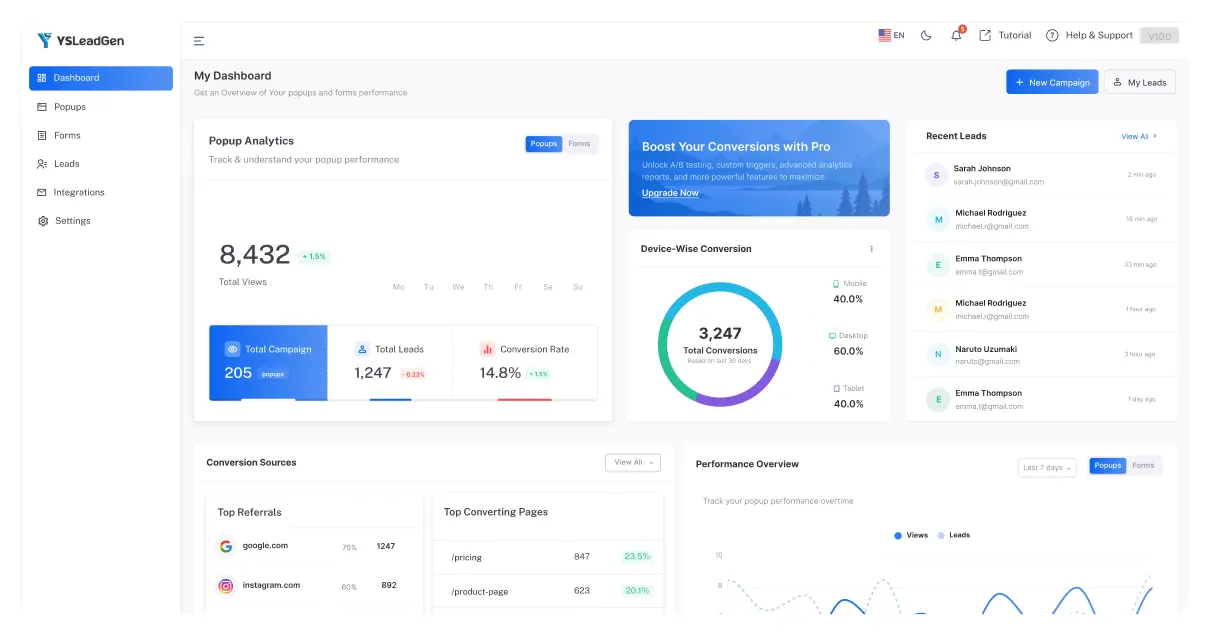
Real-Time Popup Analytics Dashboard
Know Exactly Which Popups Make You $$$
YS LeadGen’s built-in analytics dashboard gives you a complete view of popup views, leads, conversions, cart recovery, coupon performance and device-wise data — all inside your WordPress admin.
- 5/5 on WordPress.org
- 10,000+ active stores
- No 3rd-party tools needed
- 100% data inside WordPress
What's Tracked
Every Metric That Matters — Visible Inside WordPress
No Google Analytics integrations, no 3rd-party dashboards. YS LeadGen’s native analytics gives you every popup data point right inside your WordPress admin — exactly like the screenshots from your live dashboard.
Popup Views & Impressions
See exactly how many times each popup was shown — per campaign, per date range. Identify overexposed popups causing fatigue and underperforming campaigns.
Total Leads Captured
Track every email and lead captured per campaign with timestamps, source page, and lead quality scores. Exportable CSV for your email marketing tool.
Conversion Rate per Campaign
Know the exact conversion rate of every popup — views → leads ratio updated in real time. Compare campaigns side-by-side to find your top performers.
Date-Range Analytics (Last 7 / 30 days)
Filter analytics by Last 7 days, Last 30 days, or custom date range — matching exactly the date-picker you see in the YS LeadGen dashboard today.
A/B Split Test Results
Run two popup variants against each other and see which converts better with statistical confidence — make data-driven decisions about copy, design, and timing.
Top Referrals & Converting Pages
Discover which traffic sources and landing pages drive the most popup conversions — like the "Conversion Sources" section in your live YS LeadGen dashboard.
Dashboard Modules
Every Analytics Module Built Into Your WP Dashboard
The YS LeadGen analytics dashboard — exactly as you see it in your WordPress admin — broken down by what each module tells you.
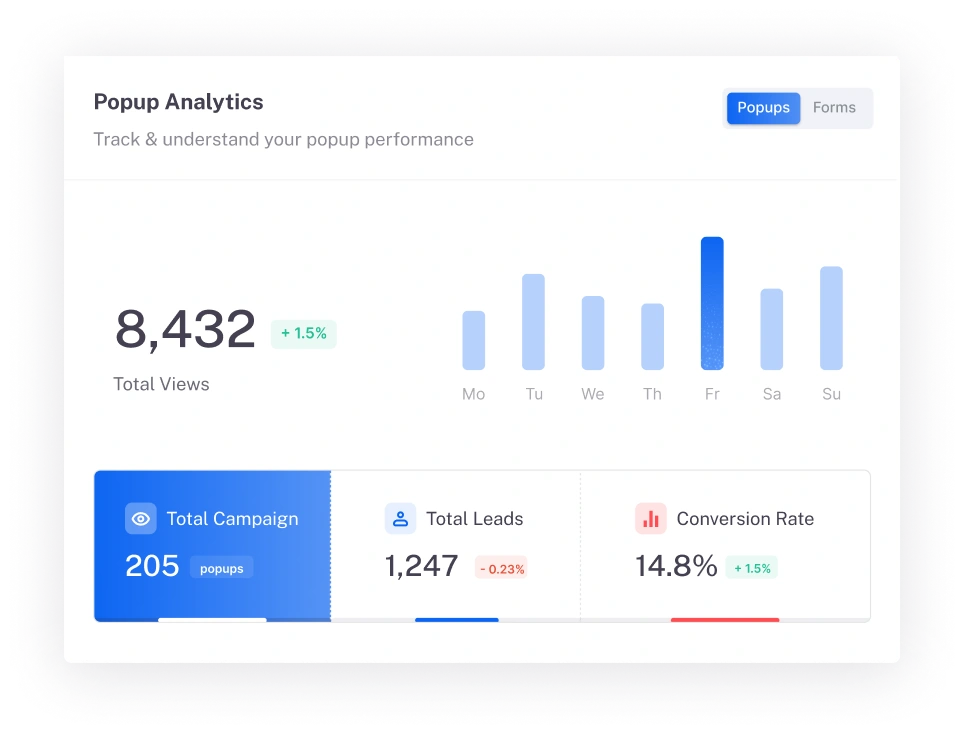
Popup Analytics Overview
The main dashboard module showing Total Popup Views, Total Leads, and Conversion Rate — with a 7-day bar chart to track performance trends at a glance.
Core Dashboard
Cart Recovery Analytics
Real-time tracking of Abandoned Carts, Recovered Carts, Recovery Rate %, and Recovered Revenue — the WooCommerce metrics that directly show popup ROI.
WooCommerce
Coupon Performance Tracking
See how many coupons were shown, redeemed, the Redemption Rate, and total Coupon Revenue generated — exactly as shown in your Popup Campaigns dashboard.
Revenue
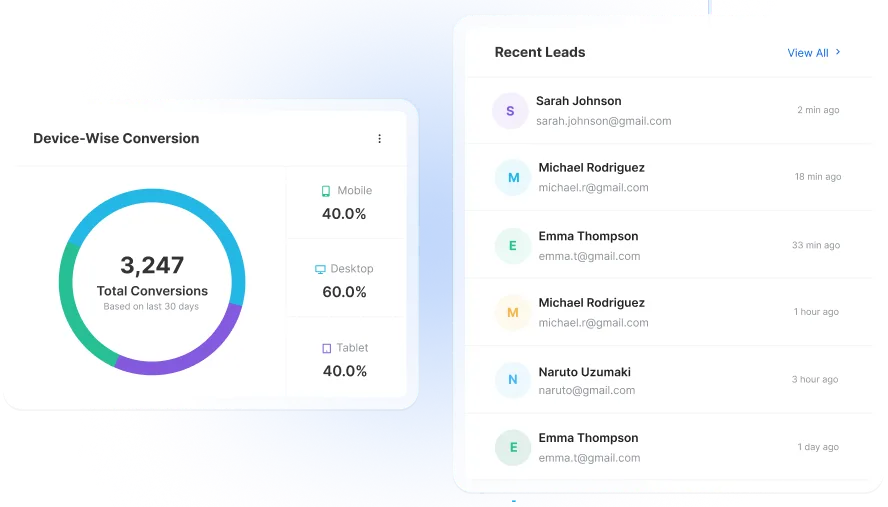
Device-Wise Conversion
Donut chart showing conversion breakdown by Mobile, Desktop, and Tablet — so you know which devices need mobile-optimised popup variants.
Device Analytics
Recent Leads Feed
Live stream of newly captured leads showing email, timestamp, and source — identical to the "Recent Leads" panel you see on your My Dashboard page.
Lead Intelligence
Conversion Sources & Top Pages
Identify Top Referral sources and Top Converting Pages from the Conversion Sources module — so you know where to focus traffic and which pages need better popups.
Traffic Intel
Performance Overview Chart
The multi-line Views vs Leads graph across time — the Performance Overview module in your dashboard that tracks momentum across popup and form campaigns.
Trend Analysis
Form Campaign Analytics
Separate analytics for Form Campaigns — tracking form views, submissions, conversion rate, and leads independently from popup campaigns.
Forms
CSV Export & Reporting
Export all leads and campaign analytics to CSV with a single click — the Export button visible in both Popup and Form campaign tables of your dashboard.
Data Export
Cart Recovery
Track Every Recovered Dollar from WooCommerce Cart Abandonment
The Cart Recovery analytics module in YS LeadGen shows you the exact revenue your exit intent and cart abandonment popups are generating — not just views, real dollars recovered.
Abandoned Carts Counted
Automatically counts how many WooCommerce shoppers abandoned their cart — synced natively without any extra plugin.
Recovered Cart Attribution
Tracks which popup was responsible for recovering the cart and completing checkout — proper last-touch attribution.
Recovered Revenue in $$$
See the exact dollar amount recovered from abandoned carts — the number you can show to justify popup ROI instantly.
Device & Lead Analytics
See Who Converts on Which Device
The Device-Wise Conversion module in your YS LeadGen dashboard tells you if mobile, desktop, or tablet visitors are converting from your popups — so you can optimise accordingly.
Coupon Analytics
Track Every Coupon You Show and Every One Redeemed
The Coupon Performance section of your YS LeadGen dashboard tracks coupons shown, redeemed, redemption rate, and coupon revenue — the metrics that prove popup ROI.
Coupons Shown Tracking
Know exactly how many times a WooCommerce coupon popup was displayed to visitors. Correlate impressions with redemptions to measure offer attractiveness.
Coupons Shown this month: 38 (+100%)
Coupons Redeemed Count
Track how many discount codes were actually used at WooCommerce checkout — not just shown. The conversion from shown to redeemed is your true coupon effectiveness rate.
Coupons Redeemed: 0 → Target: 15% rate
Redemption Rate %
The percentage of visitors who saw your coupon popup and used the code at checkout — a critical metric for A/B testing different discount levels and popup designs.
Redemption Rate: 0% → Benchmark: 12–18%
Coupon Revenue Attribution
The total revenue generated from orders that used a popup-delivered coupon code — giving you exact dollar ROI on each coupon popup campaign running on your store.
Coupon Revenue: $0.00 → Track every dollar
Data Integrations
Analytics Data Flows Into Your Entire Marketing Stack
Mailchimp
ConvertKit
ActiveCampaign
Klaviyo
Zapier
WooCommerce
GetResponse
Elementor
Fluent forms
Webhooks
Real Results
Store Owners Who Let Data Drive Their Popups
“The analytics dashboard is what makes YS LeadGen stand out. I can see exactly which popup recovered which cart, the exact revenue attributed, and device breakdown. Recovered $4,200 in my first month just by optimising based on the data.”
Sarah Rodriguez
WooCommerce Store Owner
“The coupon performance tracking told me my 10% discount popup had 0% redemption but my spin-to-win had 18%. I switched everything to spin-to-win based on that data. Revenue from recovered carts jumped 3× in 6 weeks.”
Marcus Patel
TechGadgets Store, CEO
“The device-wise conversion data showed 70% of my popup conversions came from mobile but I had no mobile-optimised popup. Fixed that in 10 minutes. Mobile conversion rate tripled. All from reading the built-in dashboard — no Google Analytics needed.”
Jennifer Liu
WooCommerce Agency Owner
Pricing
Full Analytics Dashboard. One-Time Price.
No monthly subscription. No per-site fees. Just one low payment for lifetime access to the best WooCommerce popup plugin.
Free
For small websites
0
Basic analytics for your first popup campaign.
What’s included
- 1 popup campaign
- Basic views & leads tracking
- 7-day analytics history
- WooCommerce basic integration
Pro Lifetime
For growing businesses
29/Lifetime Access
Complete analytics dashboard as seen in your YS LeadGen admin — one payment, forever.
What’s included
- Unlimited campaigns tracked
- Cart Recovery analytics
- Coupon Performance dashboard
- Device-Wise Conversion tracking
- Recent Leads live feed
- Conversion Sources & Top Pages
- Performance Overview chart
- A/B testing analytics
- CSV export
- 14-day money-back guarantee
Recommended
Agency
Marketing teams
99/Lifetime Access
Analytics across all client sites in one licence.
What’s included
- Everything in Pro
- Unlimited client sites
- Client analytics reports
- White-label dashboard
- Dedicated account manager
- FAQ
Questions About YS LeadGen Analytics
Does YS LeadGen analytics need Google Analytics or any 3rd-party tool?
What is Cart Recovery analytics and how does it work in YS LeadGen?
What does Coupon Performance tracking show in the analytics dashboard?
Coupon Performance shows 4 metrics: Coupons Shown (how many times a coupon popup was displayed), Coupons Redeemed (used at WooCommerce checkout), Redemption Rate % (shown → redeemed ratio), and Coupon Revenue (total value of orders using popup-delivered coupon codes). This helps you optimise discount percentages and popup designs based on actual redemption data.
What does Device-Wise Conversion tracking show?
Device-Wise Conversion shows what percentage of your popup conversions come from Mobile, Desktop, and Tablet users — as a donut chart in the dashboard. This data is actionable: if 70% of conversions are on mobile but your popup isn’t mobile-optimised, you’re losing most of your potential. Knowing this allows you to create device-specific popup variants.
Can I export analytics and lead data from YS LeadGen?
Yes. YS LeadGen has an Export button on both the Popup Campaigns and Form Campaigns pages that lets you download all lead data and campaign performance as a CSV. This can be imported into any email marketing tool, CRM, or spreadsheet for further analysis.